AR Forecasts from CW3E
About Atmospheric Rivers
Atmospheric Rivers (ARs) are relatively long, narrow bands of moisture in the atmosphere — like rivers in the sky — that transport water vapor from the tropical moist regions along the equator to the west coast regions. Most of our rainfall comes to us via ARs.
The times used in the images below are based on Greenwich time (aka Zulu, Z, or UTC). (See time conversion info below)
Press Ctrl-F5 to update/refresh all images.
Jump to Sections
- Plume Map
- AR Scale
- AR Scale & Integrated Water Vapor Transport (IVT) Analysis/Forecast
- AR GFS Ensemble Summary
- AR Landfall Tool
- Related Links
See details and explanation video at: Atmospheric River Scale Forecast Products .
Plume Map for 38° North (most recent)
This shows the location of the forecast for this page (larger circle) and the greatest AR magnitude forecast for points along the west coast.
Click image to enlarge

AR Scale for 38° North (most recent)
Click image to enlarge

"A", "B", "C", etc. are for Weak to Exceptional ARs (AR 1 to AR 5) and coincide with the letters in the plot below.
"X"s are for future very weak (grey) ARs.
"O"s are for past very weak (grey) ARs.
AR Scale & IVT Analysis/Forecast for 38° North (most recent)
Click image to enlarge

AR GFS Ensemble Summary for 38° North (most recent)
You can think of this as a "cross section" view of the left graphic below with time going left to right instead of right to left. Tracing the 38° North latitude line horizontally from right to left on the AR Landfall Tool graphic below should result in something like the grey shaded "plus or minus one standard deviation from the ensemble mean" band you see in this graphic.
Click image to enlarge

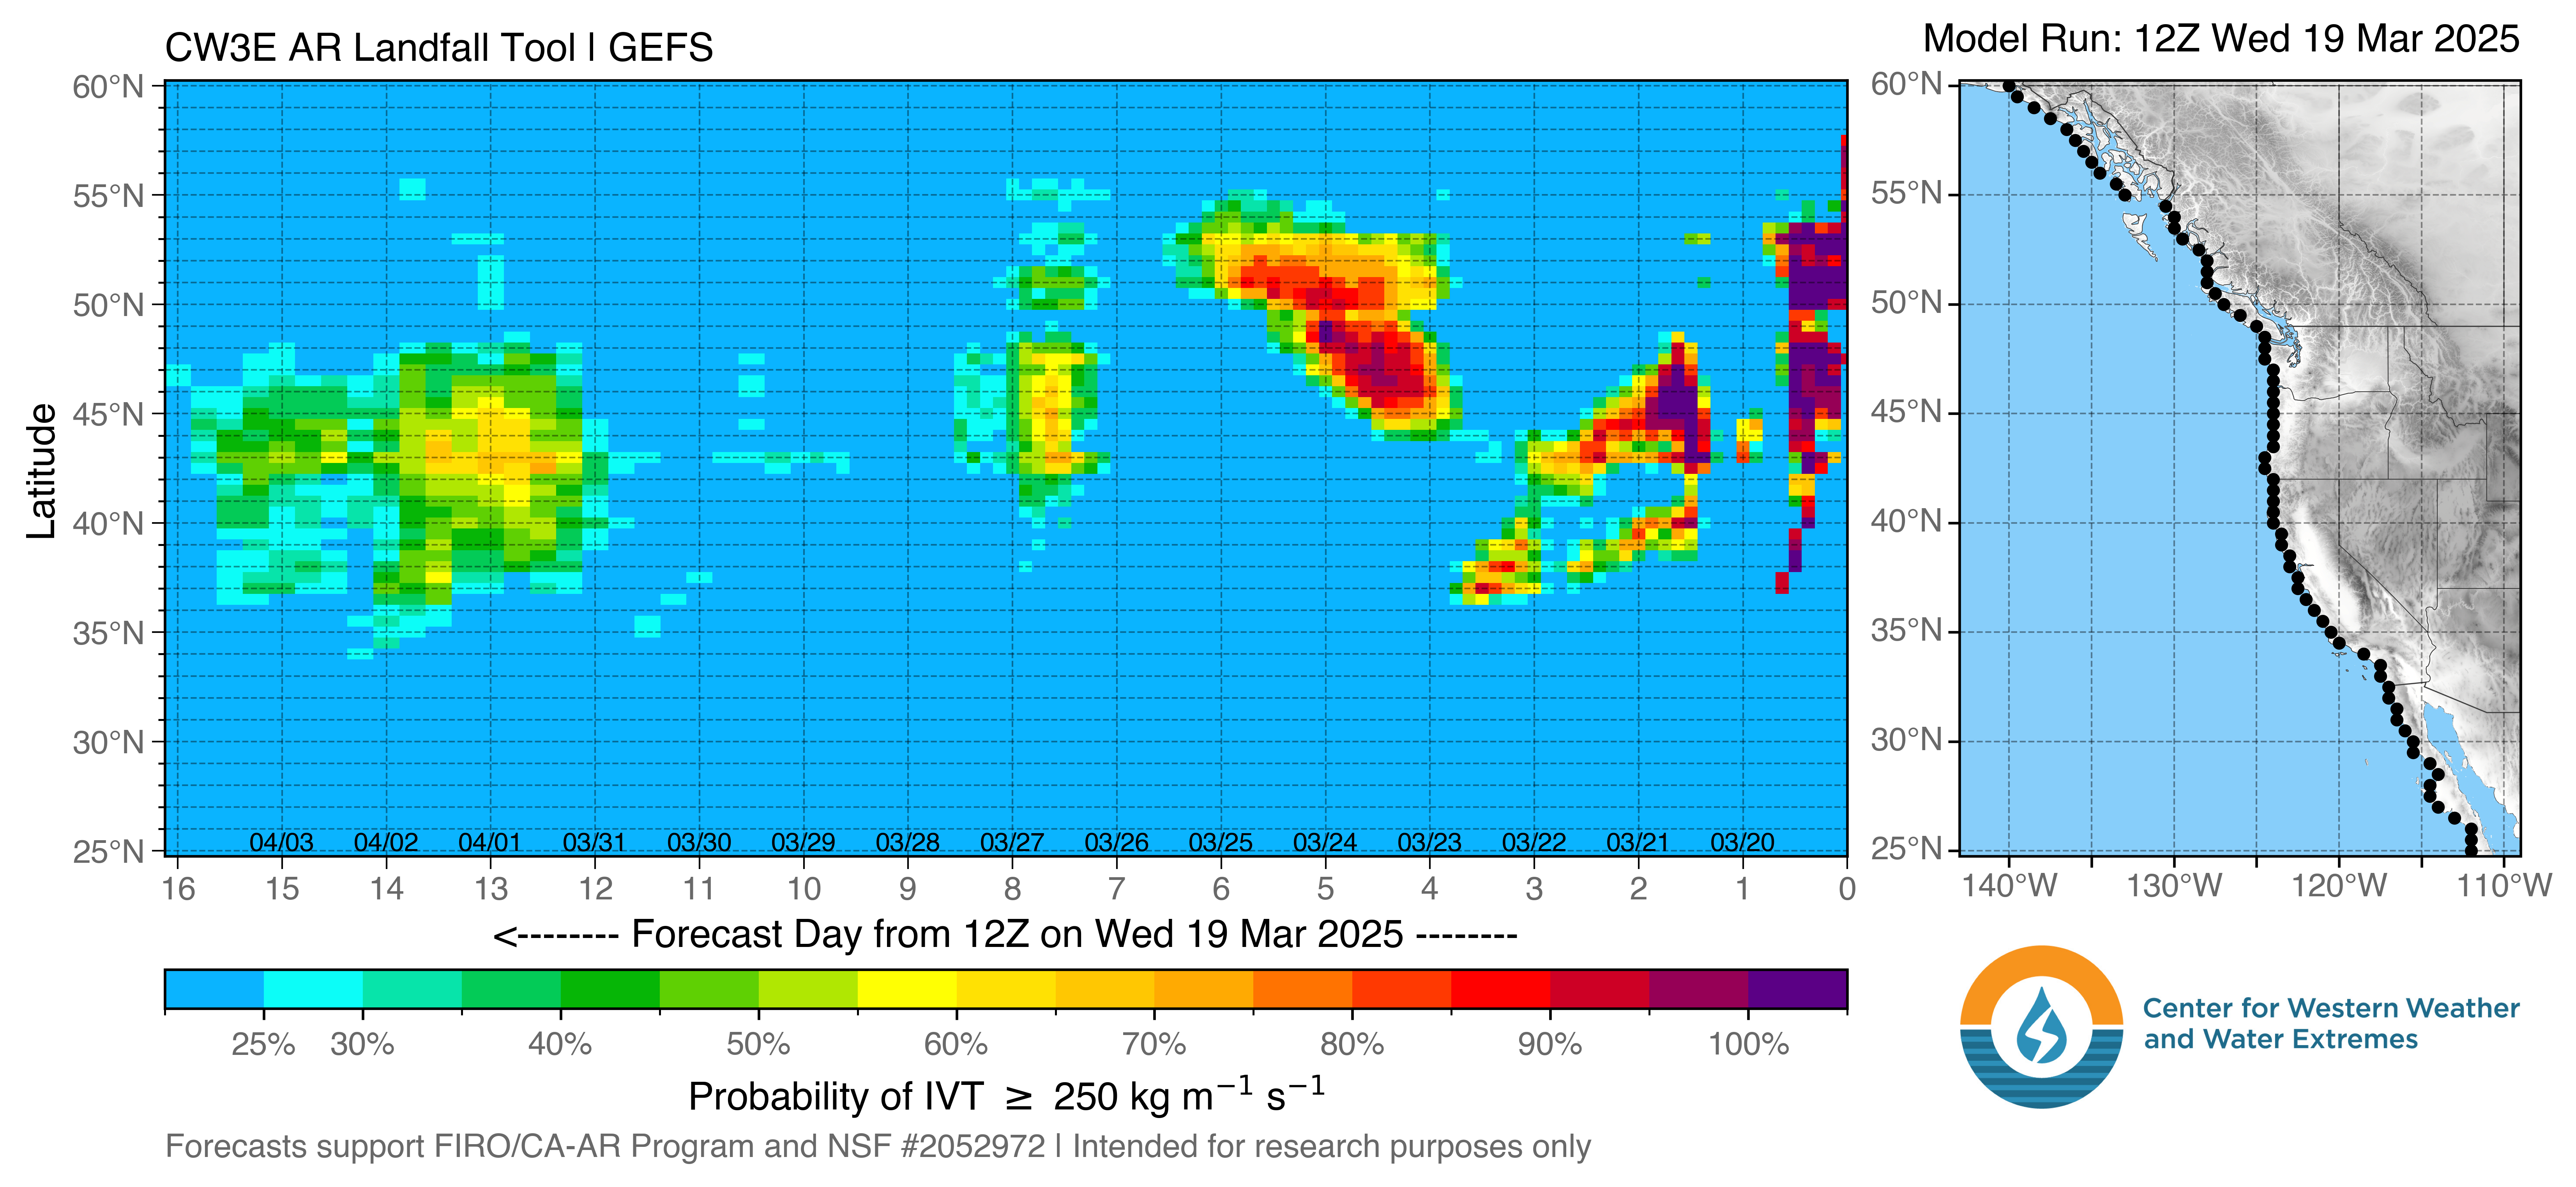
Ensemble Forecast Systems CW3E AR Landfall Tool (most recent)
The graphic below shows the timing of future ARs up to 16 days out as they are forming. For the Bay Area, find the line for 38° North latitude on the vertical axis. From right being "now" to the left being the future, it indicates the timing and probability of an AR coming onshore. The more purple, the greater the probability. When several ARs are approaching, they are called a "family" of ARs.
You can think of this as a "plan view" of the top left plot in the graphic above. The difference would be that on the graphic above time starts on the left and goes right. On the graphic below, time starts on the right and goes left.
Find the full description of this graphic on this page.
Click image to enlarge
Source
![]()
Source: Center for Western Weather and Water Extremes (CW3E)
Credits
Page Managed by:
 Hydrology Section
Contra Costa County Flood Control
and Water Conservation District
255 Glacier Drive
Martinez, CA 94553
(925) 313-2000
Reading Zulu (Z) Time for this Data
Standard Time (Fall/Winter) — Subtract 8 hours from the UTC time (00Z = 4:00PM PST day before and 12Z = 4:00AM PST same day).
Daylight Saving Time (Spring/Summer) — Subtract 7 hours from the UTC time (00Z = 5:00PM PDT day before and 12Z = 5:00AM PDT same day).
Daylight saving time starts on the second Sunday in March (move clocks forward) and ends on the first Sunday in November (moves clocks back), with the time changes taking place at 2:00 a.m. local time.
"12Z" means "12:00 Zulu Time" or noon GMT.
"00Z" means "00:00 Zulu Time" or midnight GMT.
GMT = Greenwich Mean Time