Plots of All Rain Gauges
Jump to notes about this page and data
Gauge Index
Rain Gauge Plots
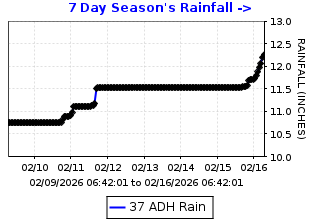
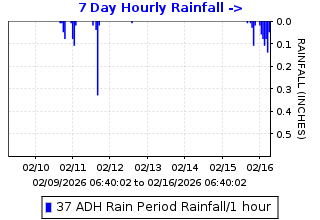
ADH37 — Arroyo Del Hambre
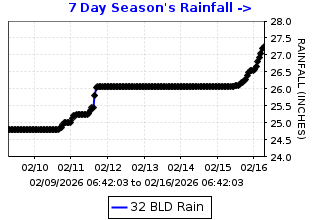
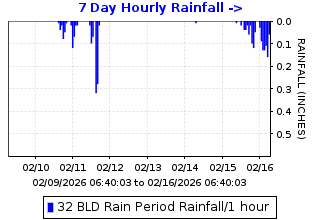
BLD32 — Bald Peak
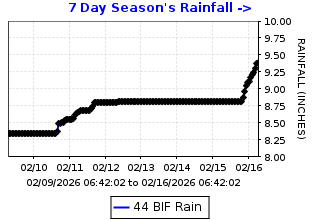
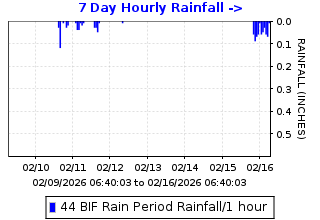
BIF44 — Bethel Island Fire Station
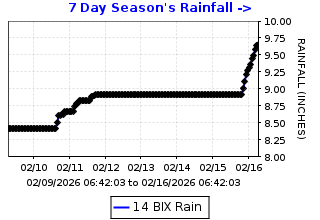
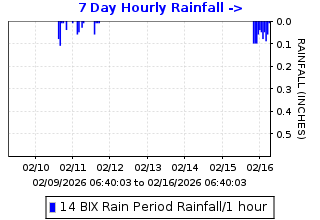
BIX14 — Bixler Pumping Plant
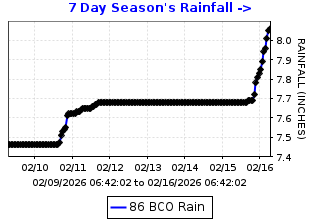
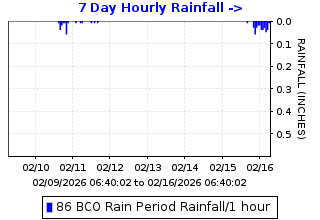
BCO86 — Brentwood Corp Yard
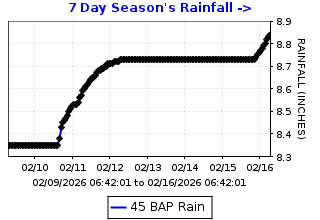
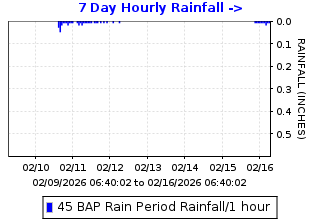
BAP45 — Byron Airport
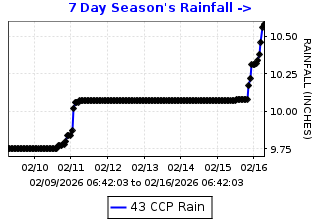
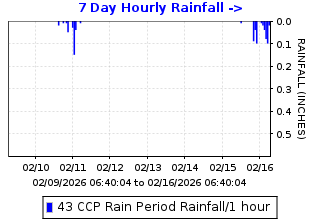
CCP43 — Concord Pavilion
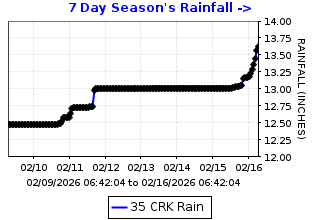
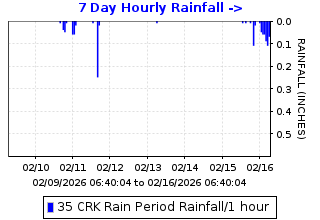
CRK35 — Cummings Peak
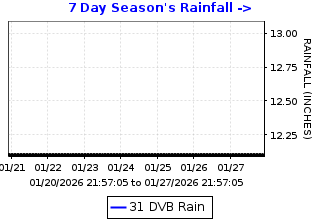
DVB31 — Danville Library

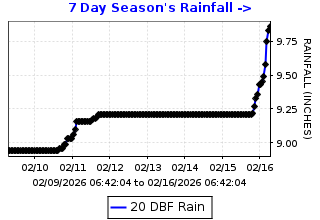
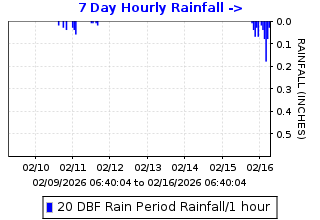
DBF20 — Dublin Fire Station
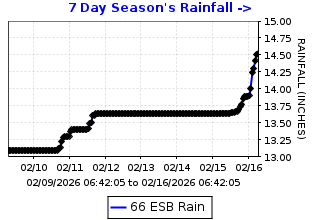
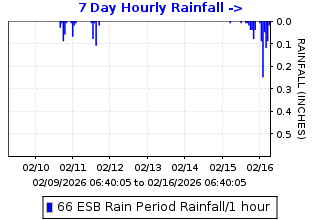
ESB66 — El Sobrante
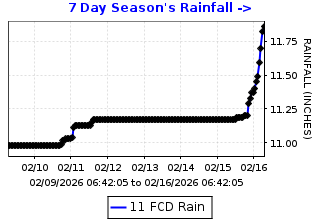
FCD11 — Flood Control Headquarters

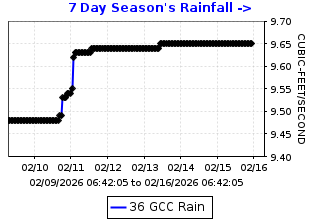
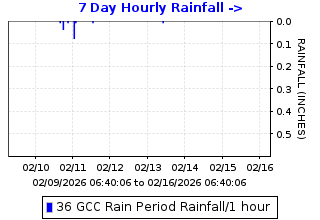
GCC36 — Grayson Creek @ Taylor Blvd
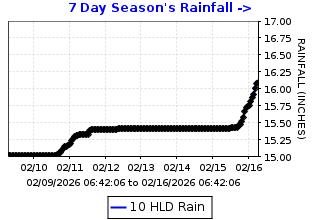
HLD10 — Highland Peak

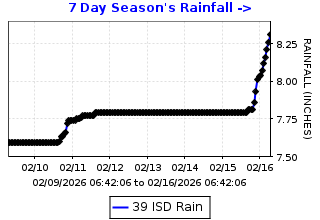
ISD39 — Ironhouse Sanitary District

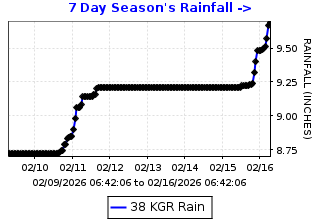
KGR38 — Kregor Peak

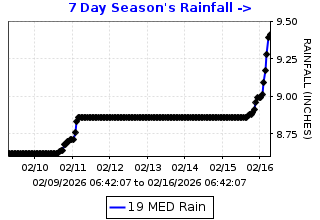
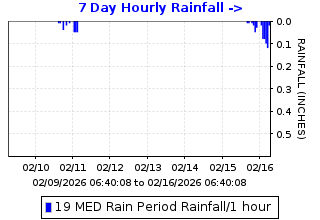
MED19 — Los Medanos
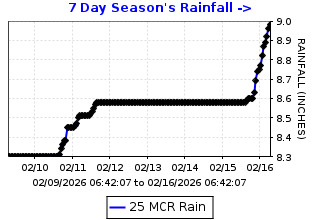
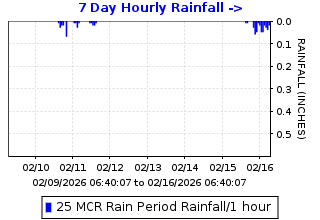
MCR25 — Marsh Cr Reservoir
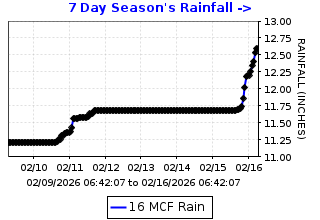
MCF16 — Marsh Creek Fire Sta. @ Marsh Creek

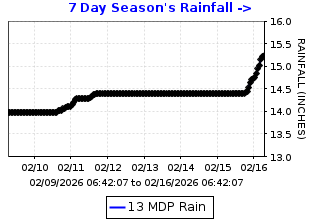
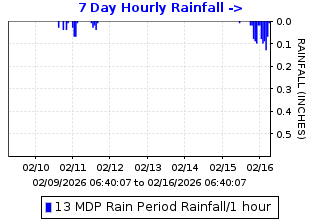
MDP13 — Mt Diablo Park Headquarters
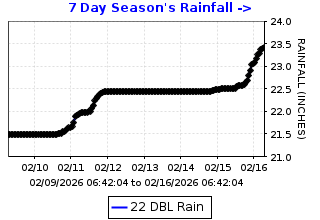
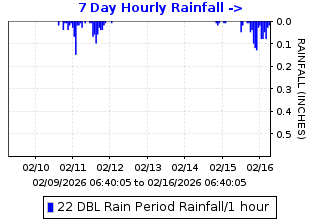
DBL22 — Mt Diablo Peak
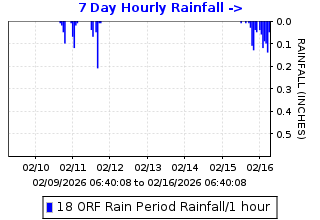
ORF18 — Orinda Fire Station

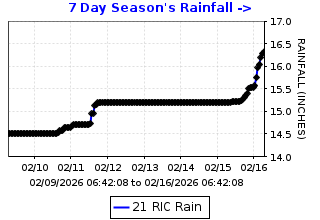
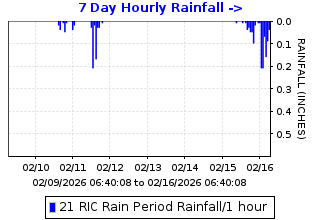
RIC21 — Richmond City Hall
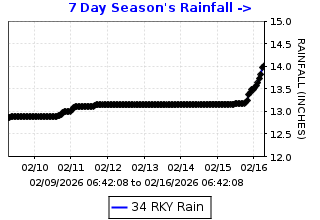
RKY34 — Rocky Ridge

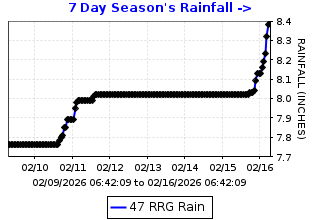
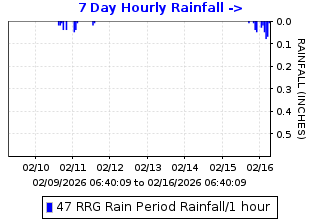
RRG47 — Roddy Ranch Golf Club
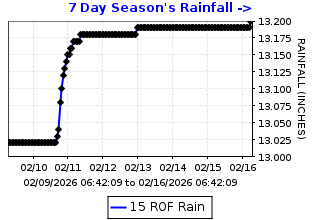
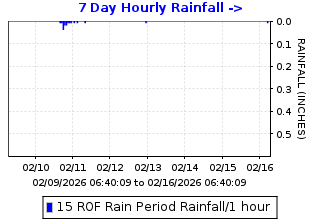
ROF15 — Rodeo Fire Station
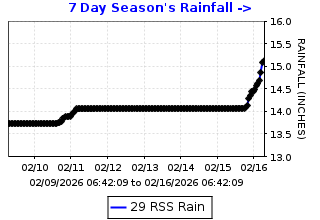
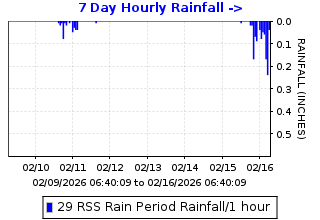
RSS29 — Rossmoor
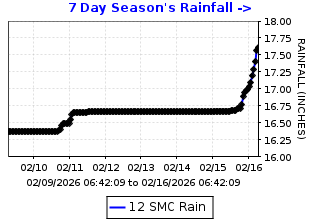
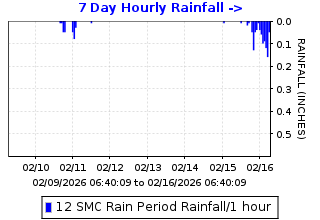
SMC12 — St. Mary's College
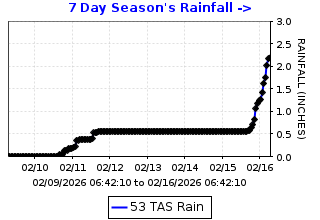
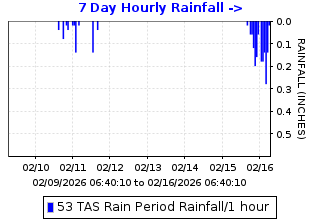
TAS53 — Tassajara
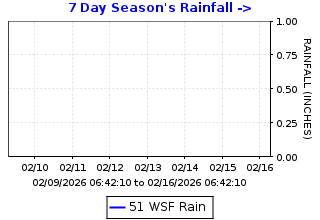
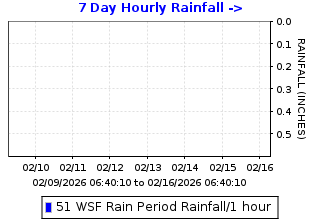
WSF51 — Weapons Station Fire
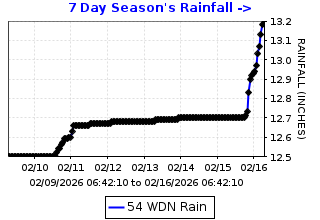
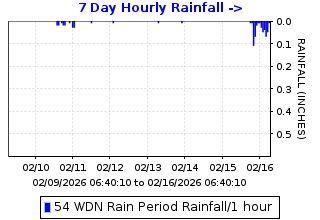
WDN54 — Wiedemann Hill
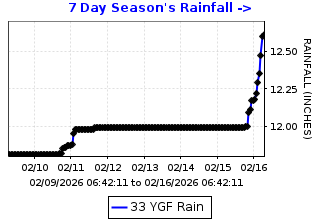
YGF33 — Ygnacio Valley Fire Station

Notes
This provides a quick view of all the rain gauge plots on one page. In the cumulative view the steeper the curve is, the more intense the rainfall is. Seeing these plots all together allows us to compare their general shapes. If a curve is “rounder” or “flatter” than the others during a storm, we can suspect the gauge is plugged. The hourly rain plot also helps us see if there is a plugged gauge. If we see small amounts of rain recorded for several hours and other gauges not doing this, we can suspect a clogged gauge.
Note that the vertical scale is different from plot to plot.
If a plot is missing it is likely due to a minor data transmission error. The plot should appear during the next data transmission process.
Modified: 2022-01-17