Stream Gauge Plots
Jump to notes about this page and data
Gauge Index
Stream Gauge Stage Plots
Alhambra Creek @ D Street
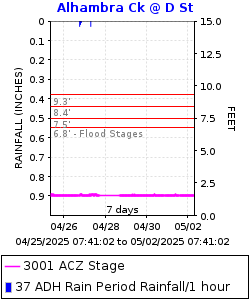
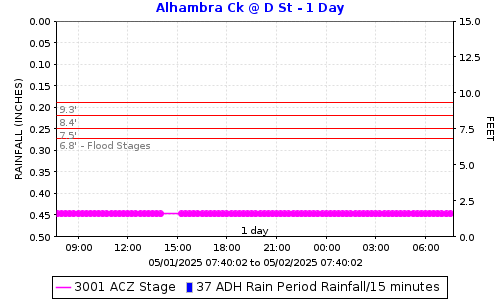
Flood Stage Information for ACZ CDEC Plot ACZ Battery Back to top
Alhambra Creek @ Ward Street
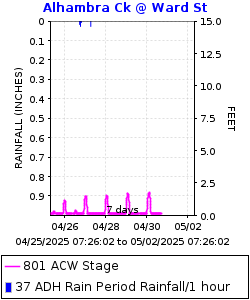
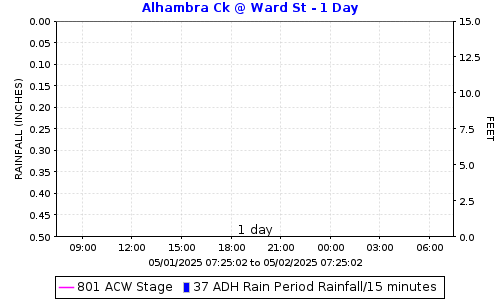
Flood Stage Information for ACW CDEC Plot ACW Battery Back to top
Galindo Creek @ Treat Blvd
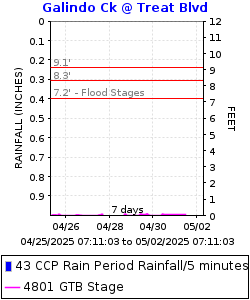
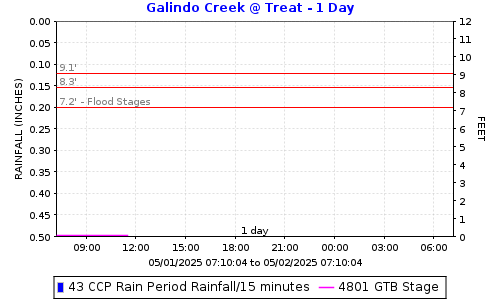
Flood Stage Information for GTB CDEC Plot GTB Battery Back to top
Grayson Creek @ Center Ave
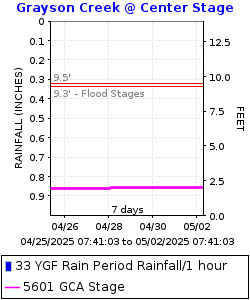
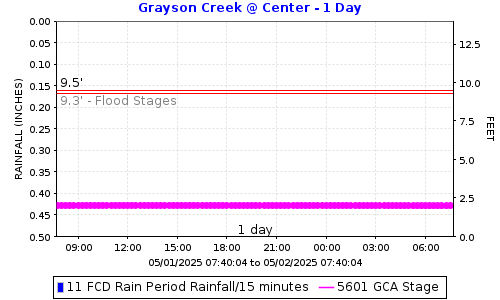
Flood Stage Information for GCA CDEC Plot GCA Battery Back to top
Grayson Creek @ Taylor Blvd
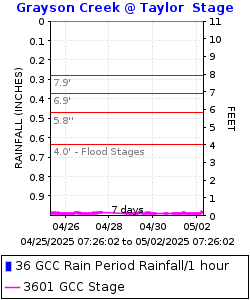
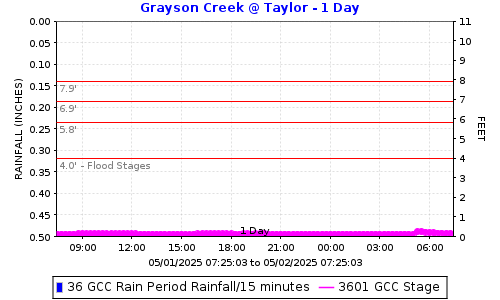
Flood Stage Information for GCC CDEC Plot GCC Battery Back to top
Green Valley Creek @ Diablo Rd
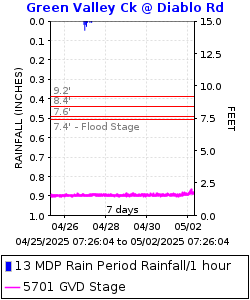
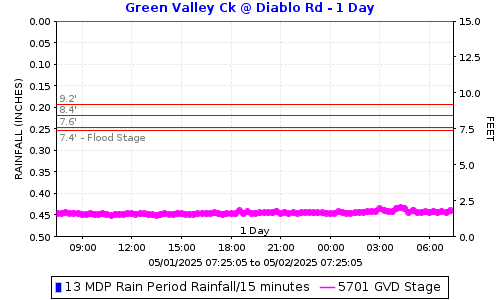
Flood Stage Information for GVD CDEC Plot GVD Battery Back to top
Marsh Creek @ Brentwood
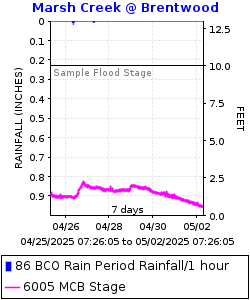
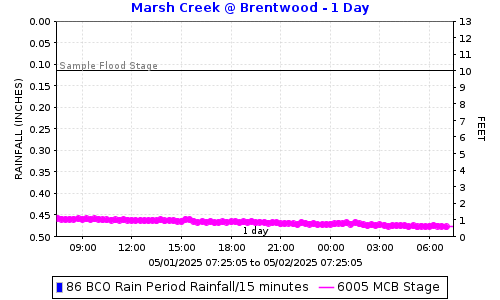
Flood Stage Information for MCB CDEC Plot MCB Battery Back to top
Marsh Creek @ Dainty Ave
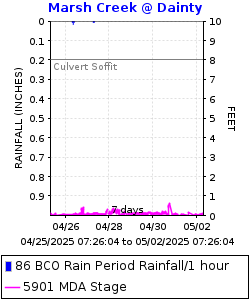
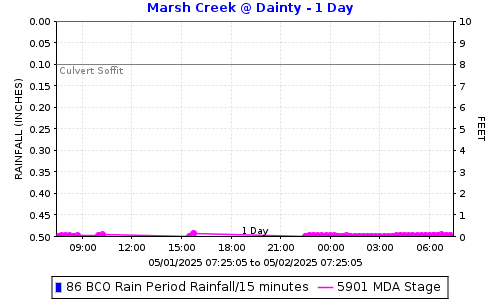
Flood Stage Information for MDA CDEC Plot MDA Battery Back to top
Marsh Creek Fire Sta. @ Marsh Creek
Flood Stage Information for MCF CDEC Plot MCF Battery Back to top
Marsh Cr Reservoir
Note: The Marsh Creek Reservoir gauge is not working properly.
Flood Stage Information for MCR CDEC Plot MCR Battery Back to top
Pinole Creek @ San Pablo Ave
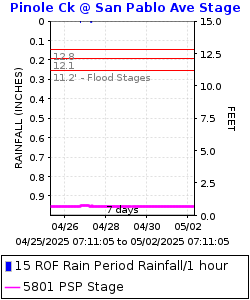
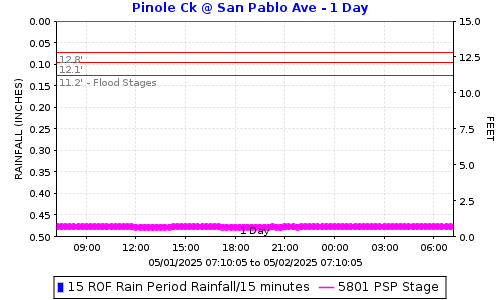
Flood Stage Information for PSP CDEC Plot PSP Battery Back to top
Rodeo Creek @ Hawthorne Dr
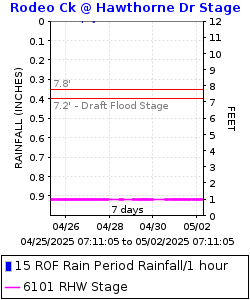
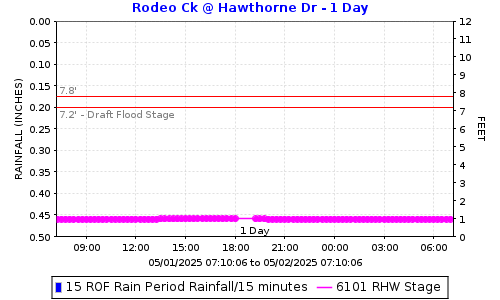
Flood Stage Information for RHW CDEC Plot RHW Battery Back to top
Tice Creek @ Rossmoor Basin
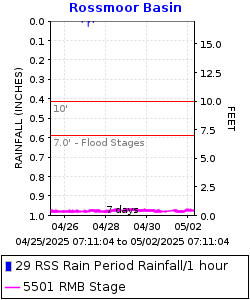
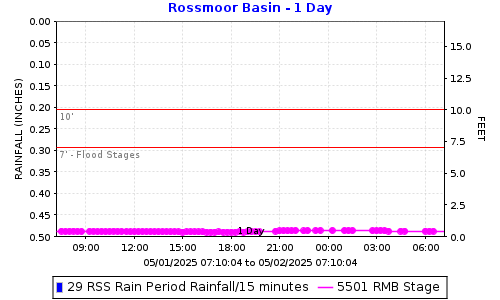
Flood Stage Information for RMB CDEC Plot RMB Battery Back to top
Walnut Creek @ Diamond Blvd
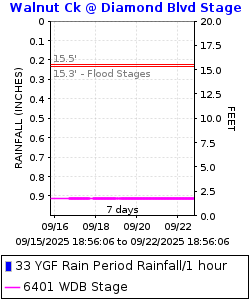
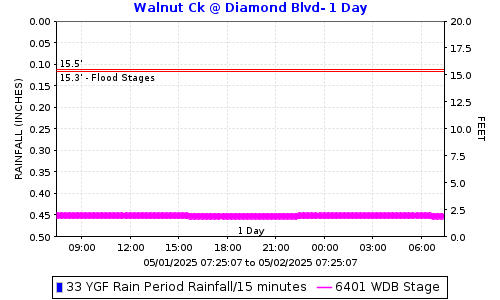
Flood Stage Information for WDB CDEC Plot WDB Battery Back to top
Walnut Creek @ Marsh Dr
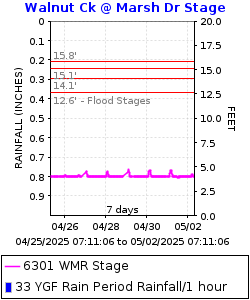
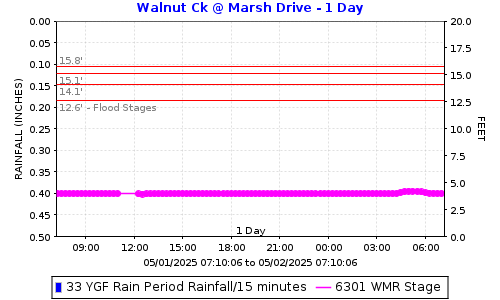
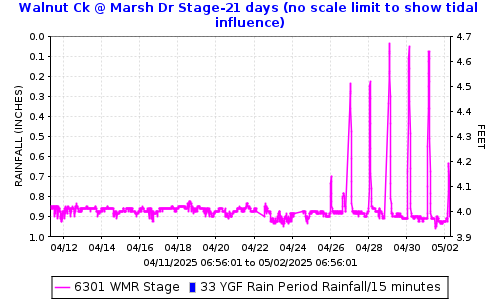
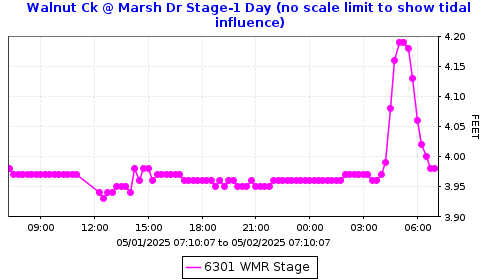
Flood Stage Information for WMR CDEC Plot WMR Battery Back to top
Walnut Creek @ Ygnacio
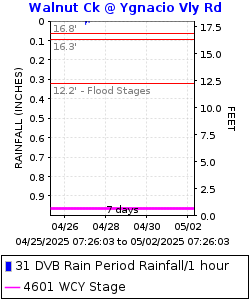
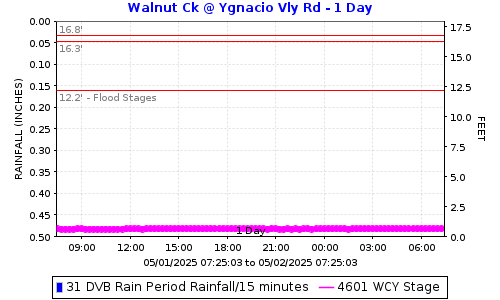
Flood Stage Information for WCY CDEC Plot WCY Battery Back to top
Wildcat Creek @ Vale Rd Bridge
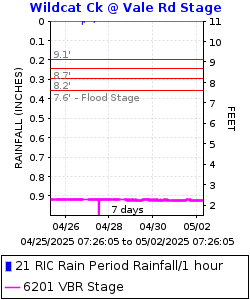
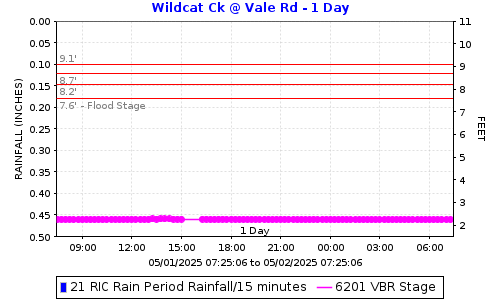
Flood Stage Information for VBR CDEC Plot VBR Battery Back to top
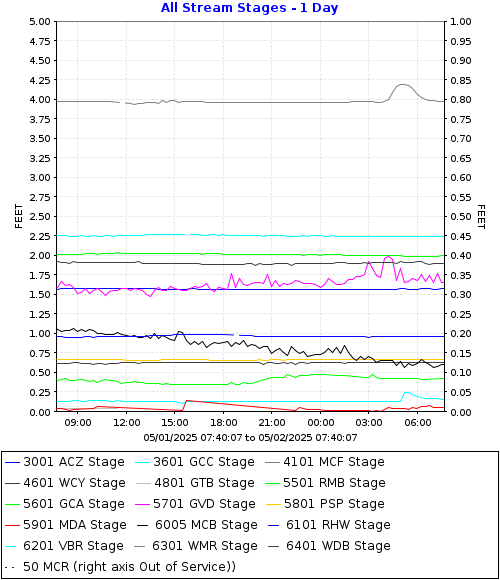
All Stream Gauge Plot
The All Stream Stages plot below provides a view of all the stream gauges at one time. The scales are not locked to any maximum or minimum so the scale will change. The Marsh Creek Reservoir stage is much higher than the others and is read on the right vertical scale.
Notes
This provides a quick view of all the stream gauge plots on one page.
During cloudy times we struggle to keep batteries charged. We can opt to poll for data less often, such as once an hour. This results in a delay in the data showing on the plots and map, but data is not lost. If we see the creek depths going up quickly, and if we have access to the system, we will increase the polling frequency to 20 minutes, the same frequency we use to collect data from our sensors.
If a plot is missing it is likely due to a data transmission error. The plot should appear during the next data transmission process.